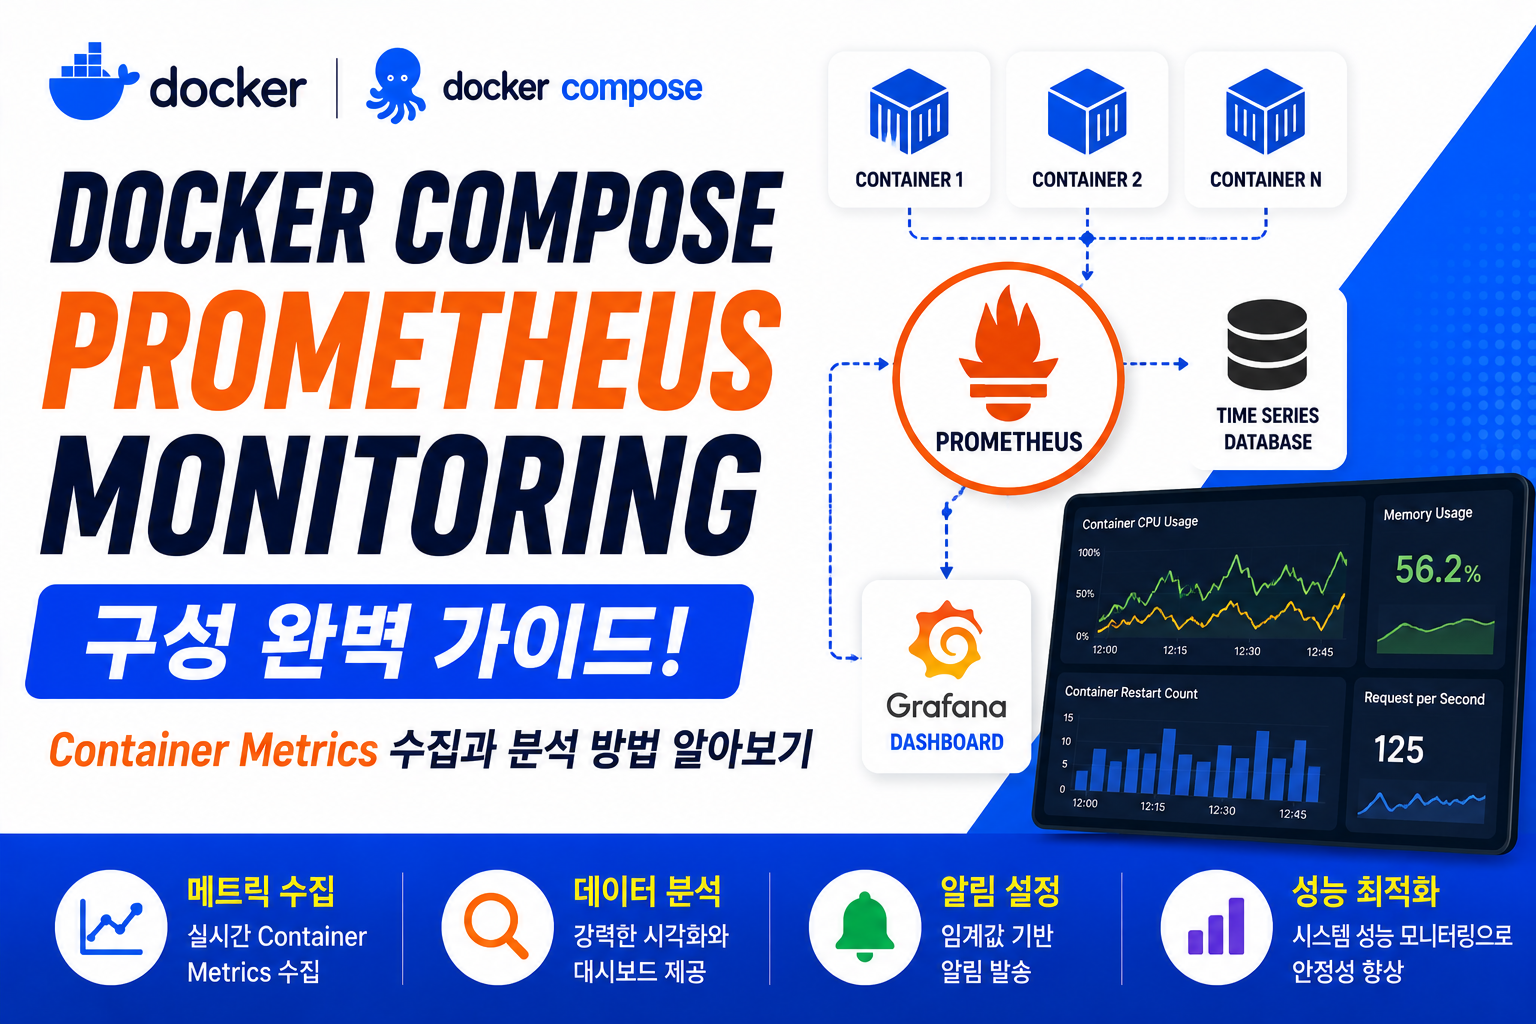
Production 서버 운영에서 가장 중요한 것은 문제가 발생하기 전에 상태를 확인하고 빠르게 대응하는 것입니다.
Container가 정상적으로 실행되고 있어도 내부적으로는 다양한 문제가 발생할 수 있습니다.
예:
CPU 증가

↓

Memory 부족

↓

Response 지연

↓

서비스 장애
이러한 문제를 발견하기 위해서는 서버 상태 데이터를 지속적으로 수집해야 합니다.
이 역할을 담당하는 대표적인 Monitoring 도구가 Prometheus입니다.
기본 구조:
Container

↓

Metrics Exporter

↓

Prometheus

↓

Grafana Dashboard
Prometheus는 서버와 Application의 다양한 Metrics를 수집하고 저장하는 Monitoring 시스템입니다.
이번 글에서는 Docker Compose 환경에서 Prometheus 구성 방법, Container Metrics 수집, Exporter 연결, Query 사용법, Production Monitoring 구조까지 알아보겠습니다.
Prometheus란 무엇인가?
Prometheus는 오픈소스 Metrics Monitoring 시스템입니다.
주요 기능:
- Metrics 수집
- Time Series Database 저장
- Query 분석
- Alert 연동
데이터 형태:
CPU Usage

Memory Usage

Request Count

Response Time

Network Traffic
기본 구조:
Target

↓

Prometheus Server

↓

Storage

↓

Visualization
Docker Compose Monitoring 구조
일반적인 구성:
Docker Container

↓

Node Exporter

↓

Prometheus

↓

Grafana

↓

Dashboard
각 역할:
Prometheus:
Metrics 저장
Exporter:
데이터 제공
Grafana:
시각화
Docker Compose Prometheus 구성
기본 docker-compose.yml:
services:

  prometheus:

    image: prom/prometheus

    container_name: prometheus

    ports:

      - "9090:9090"

    volumes:

      - ./prometheus.yml:/etc/prometheus/prometheus.yml
실행:
docker compose up -d확인:
docker ps결과:
prometheus runningPrometheus 설정 파일 구성
prometheus.yml:
global:

  scrape_interval: 15s


scrape_configs:

  - job_name: docker

    static_configs:

      - targets:

        - localhost:9090
설명:
scrape_interval:
Metrics 수집 주기
job_name:
수집 대상 이름
targets:
Metrics 주소
Docker Compose Node Exporter 구성
Container만 보는 것이 아니라 Host Server 상태도 필요합니다.
Node Exporter 역할:
- CPU
- Memory
- Disk
- Network
구조:
Server

↓

Node Exporter

↓

Prometheus
Compose:
node-exporter:

  image: prom/node-exporter

  ports:

    - "9100:9100"
수집 데이터:
node_cpu_seconds_total

node_memory

node_filesystem
Docker Container Metrics 수집
Docker 환경에서는 Container Metrics가 중요합니다.
확인:
- Container CPU
- Container Memory
- Network
- Disk
구조:
Container

↓

Metrics

↓

Prometheus
대표 방식:
- cAdvisor
- Docker Exporter
Docker Compose cAdvisor 구성
cAdvisor는 Container 상태를 수집합니다.
구조:
Docker Container

↓

cAdvisor

↓

Prometheus
Compose:
cadvisor:

  image: gcr.io/cadvisor/cadvisor

  ports:

    - "8080:8080"
수집:
Container CPU

Container Memory

Container Network
Prometheus Query(PromQL) 기본 사용법
Prometheus는 PromQL이라는 Query 언어를 사용합니다.
CPU 확인:
rate(container_cpu_usage_seconds_total[5m])Memory:
container_memory_usage_bytesNetwork:
container_network_receive_bytes_total활용:
현재 상태 분석

↓

장애 원인 확인
Docker Compose Prometheus와 Grafana 연결
Prometheus는 데이터를 저장하고 Grafana가 보여줍니다.
구조:
Prometheus

↓

Grafana

↓

Dashboard
Grafana Data Source:
URL

http://prometheus:9090
연결 후:
- CPU Dashboard
- Memory Dashboard
- Container Dashboard
구성이 가능합니다.
Docker Compose Monitoring Dashboard 구성
운영 Dashboard 예:
System:
CPU

Memory

Disk
Container:
Running Container

Restart Count

Resource Usage
Application:
Request

Error

Latency
Prometheus Alert 연동
Prometheus는 이상 상태를 감지할 수 있습니다.
예:
CPU > 90%

↓

Alert 발생
구조:
Prometheus

↓

Alertmanager

↓

Slack / Email
Docker Compose Production Monitoring 구조
실제 운영:
User

↓

Application

↓

Container

↓

Exporter

↓

Prometheus

↓

Grafana

↓

Alertmanager
Prometheus Monitoring 운영 Best Practice
추천:
- 수집 주기 설정
- Retention 관리
- Dashboard 구성
- Alert Rule 작성
- Exporter 관리
- 장애 테스트
운영 흐름:
Metrics 수집

↓

분석

↓

이상 감지

↓

Alert

↓

조치
Prometheus와 Docker Compose 장점
장점:
Container 상태 확인
실시간 Resource 확인 가능
장애 원인 분석
데이터 기반 분석 가능
자동 Alert
문제 발생 즉시 알림
확장 가능
Kubernetes 환경으로 확장 가능
자주 묻는 질문
Prometheus는 Docker Compose에서도 사용할 수 있나요?
가능합니다. Prometheus 자체를 Container로 실행할 수 있습니다.
Grafana 없이 Prometheus만 사용할 수 있나요?
가능하지만 시각화는 Grafana와 함께 사용하는 경우가 많습니다.
Prometheus는 Log도 저장하나요?
아닙니다. Metrics 저장 목적이며 Log는 Loki 같은 시스템을 사용합니다.
작은 서버에도 Monitoring이 필요한가요?
기본적인 CPU, Memory, Disk Monitoring부터 적용하는 것이 좋습니다.
마무리
Docker Compose Prometheus Monitoring 구성은 Production 서버 상태를 데이터 기반으로 관리하기 위한 핵심 기술입니다.
최종 구조:
Docker Container

↓

Exporter

↓

Prometheus

↓

Grafana

↓

Alertmanager
Container 환경이 커질수록 감으로 서버를 관리하는 것이 아니라 Metrics 데이터를 기반으로 운영해야 안정적인 서비스를 유지할 수 있습니다.
다음 글에서는 Prometheus 데이터를 시각적으로 관리하는 Docker Compose Grafana 대시보드 구성 방법을 알아보겠습니다.